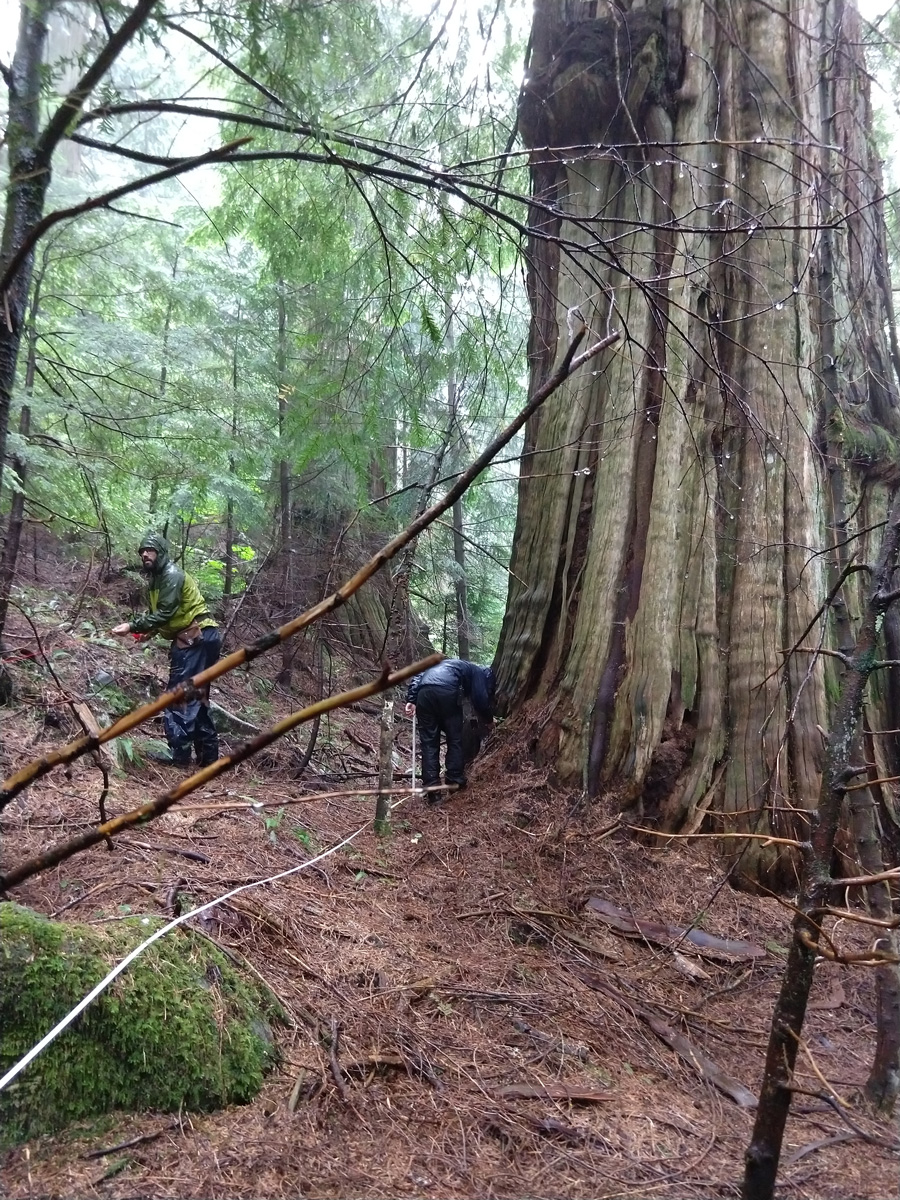
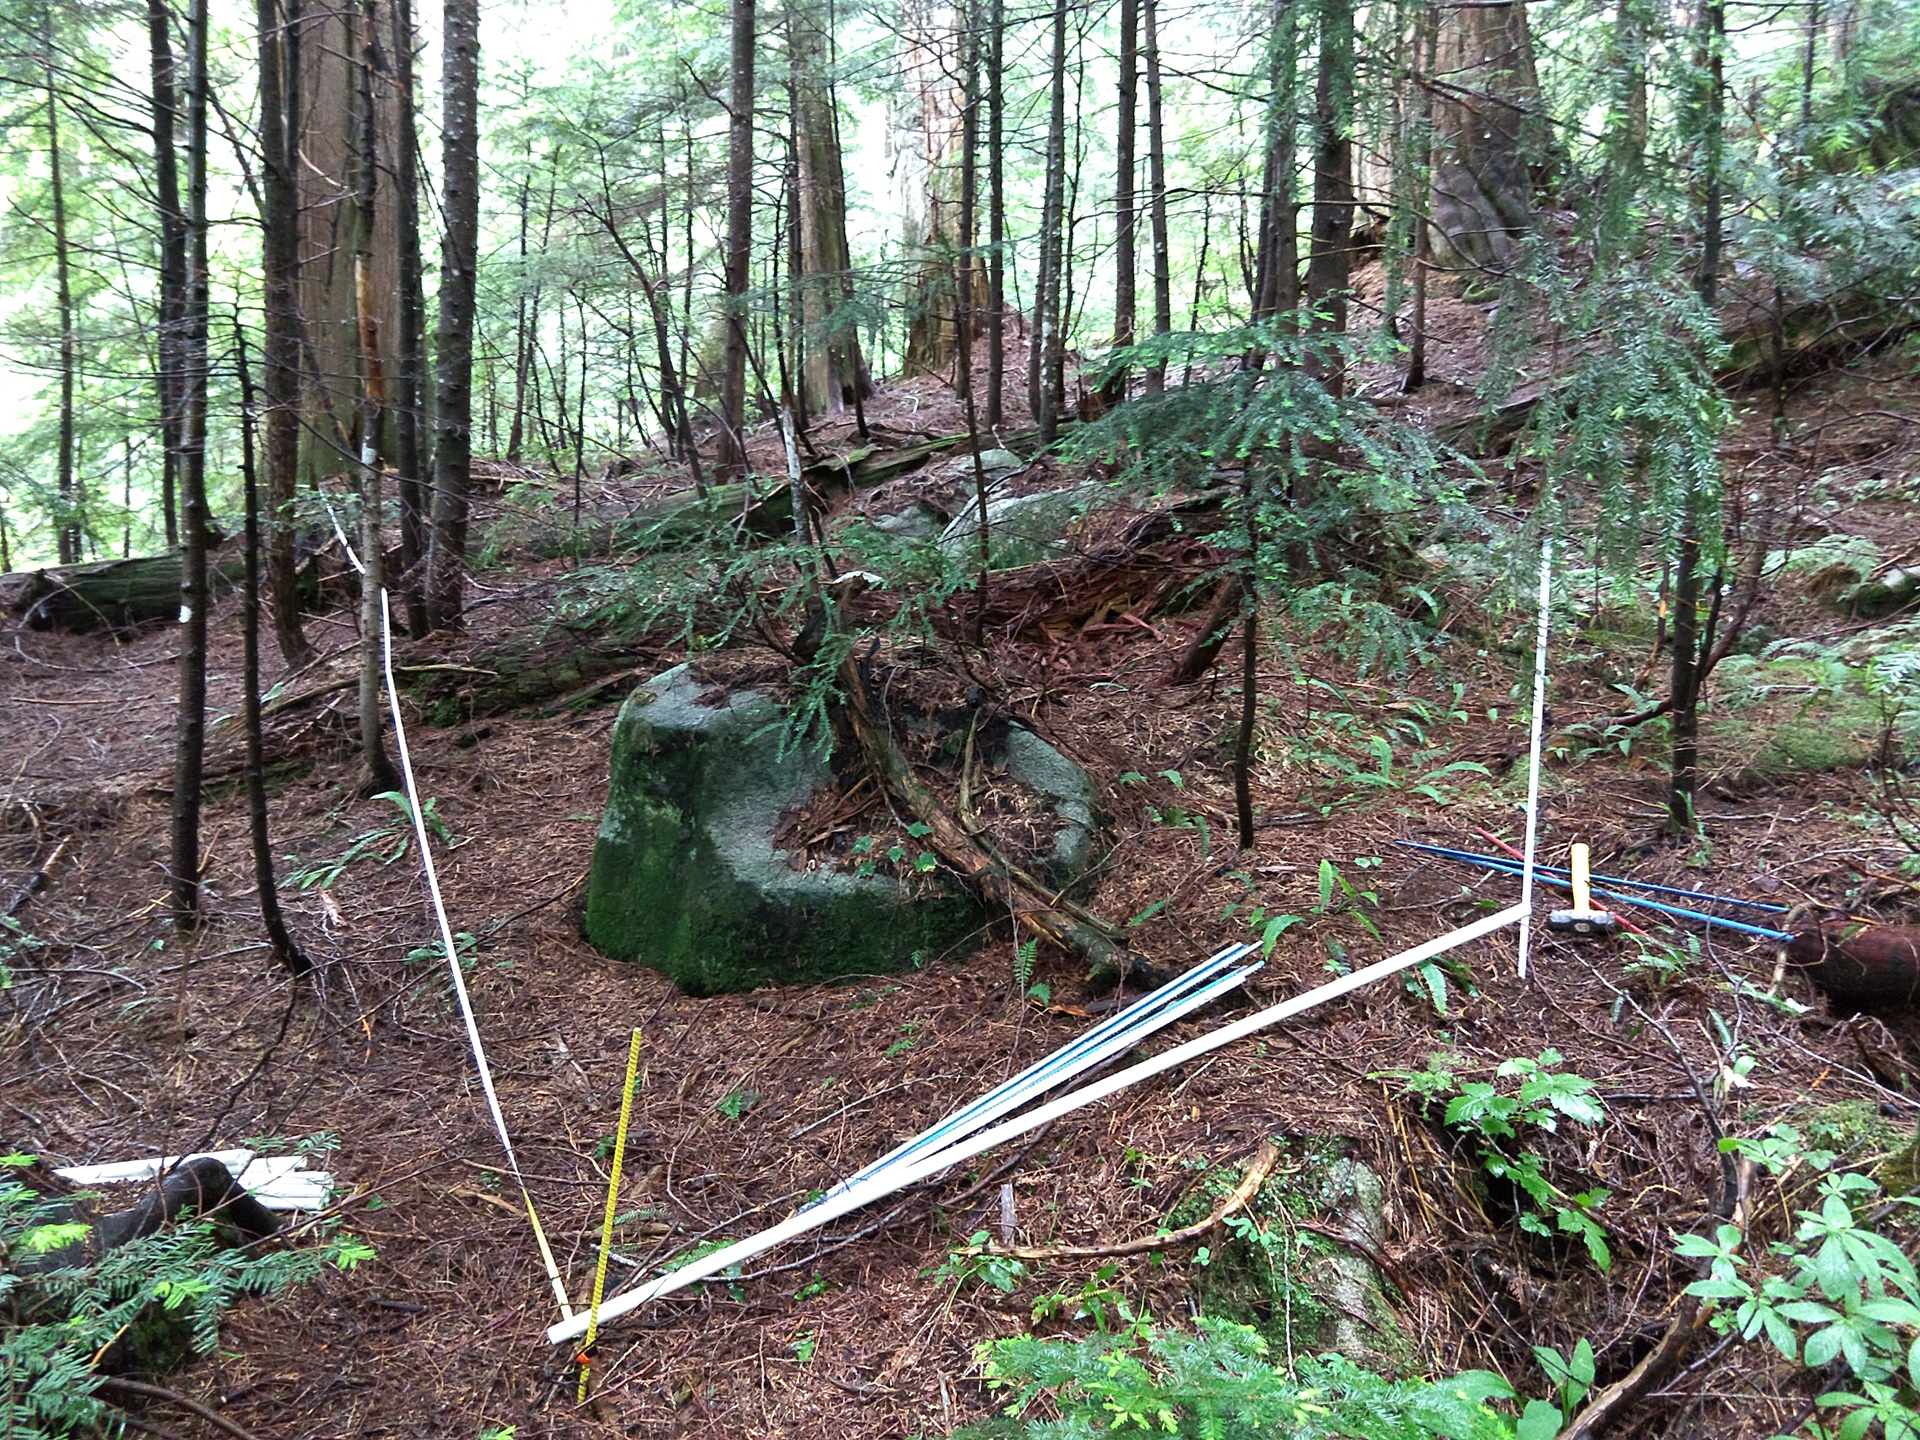
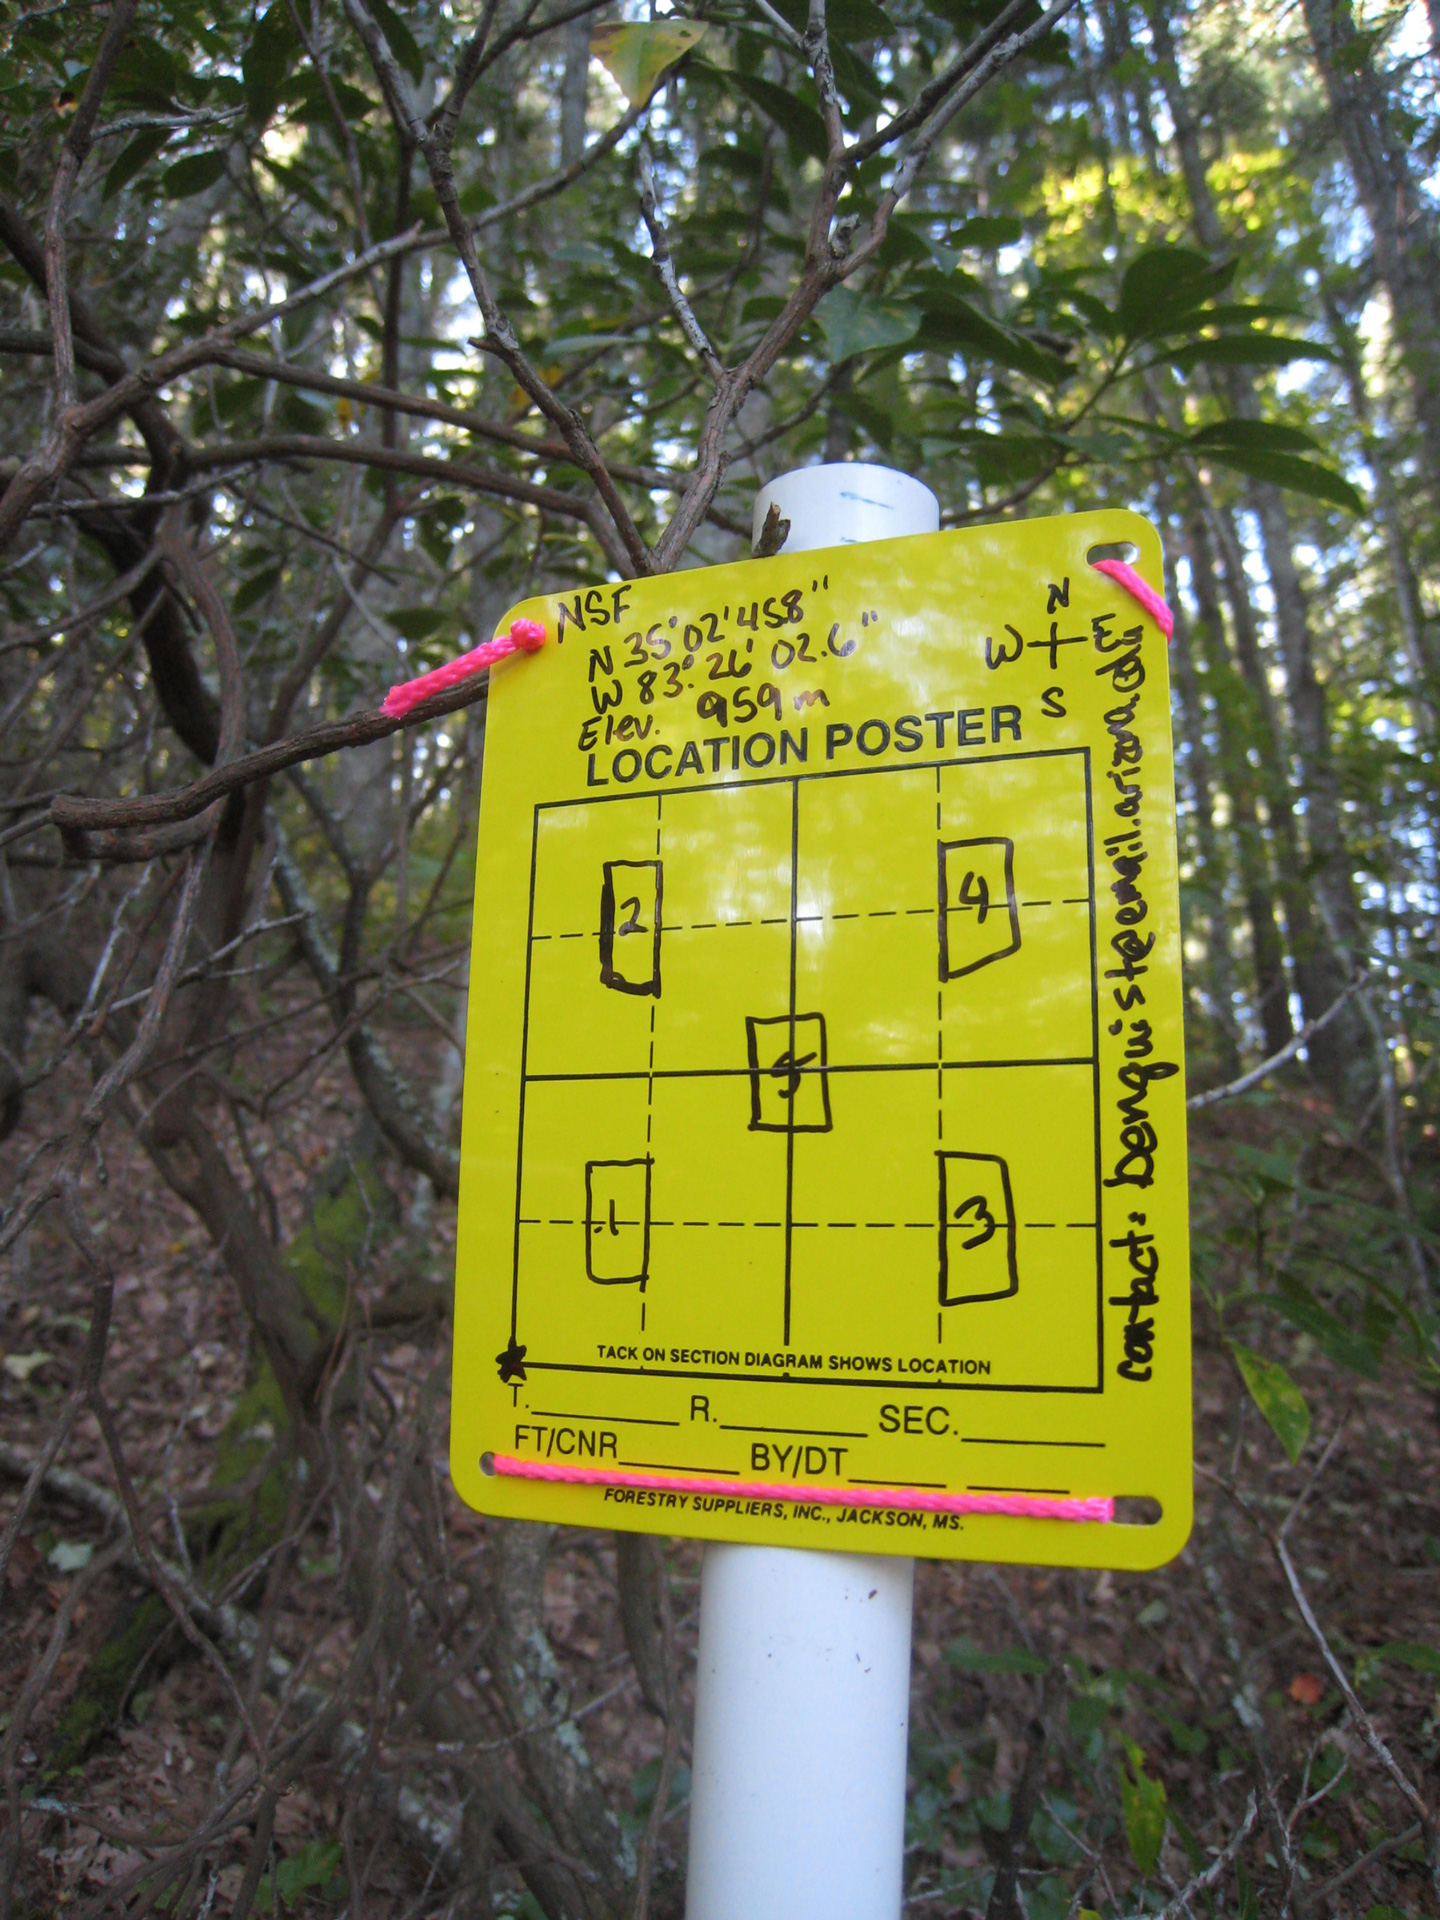
Each site consists of one 25 ha “macroplot” comprises five modified 0.1 ha “Gentry plots” (Figure 1). Each Gentry plot consists of ten 50 x 2 m belt transects that are separated by 8m from each other. Hence, the external dimensions of each Gentry plot is 42 x 100m.
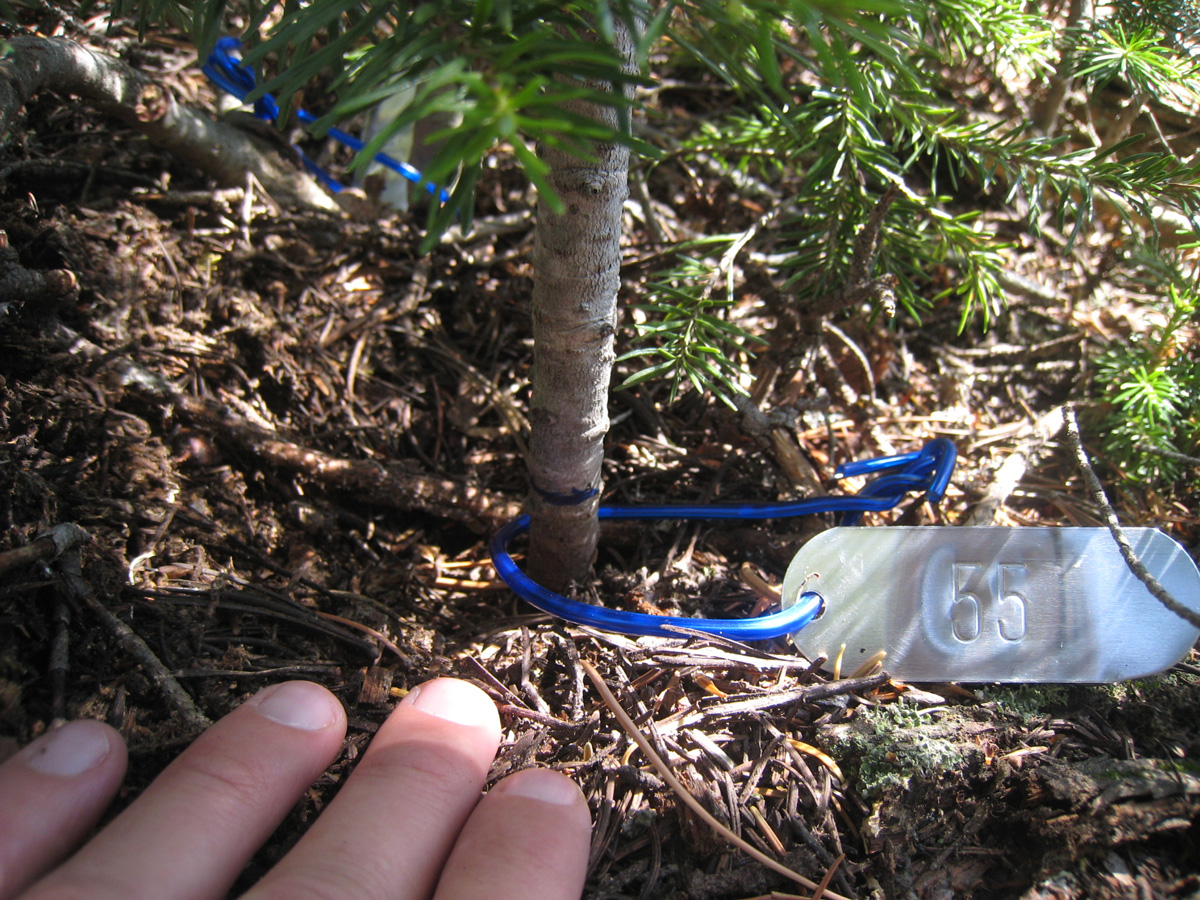
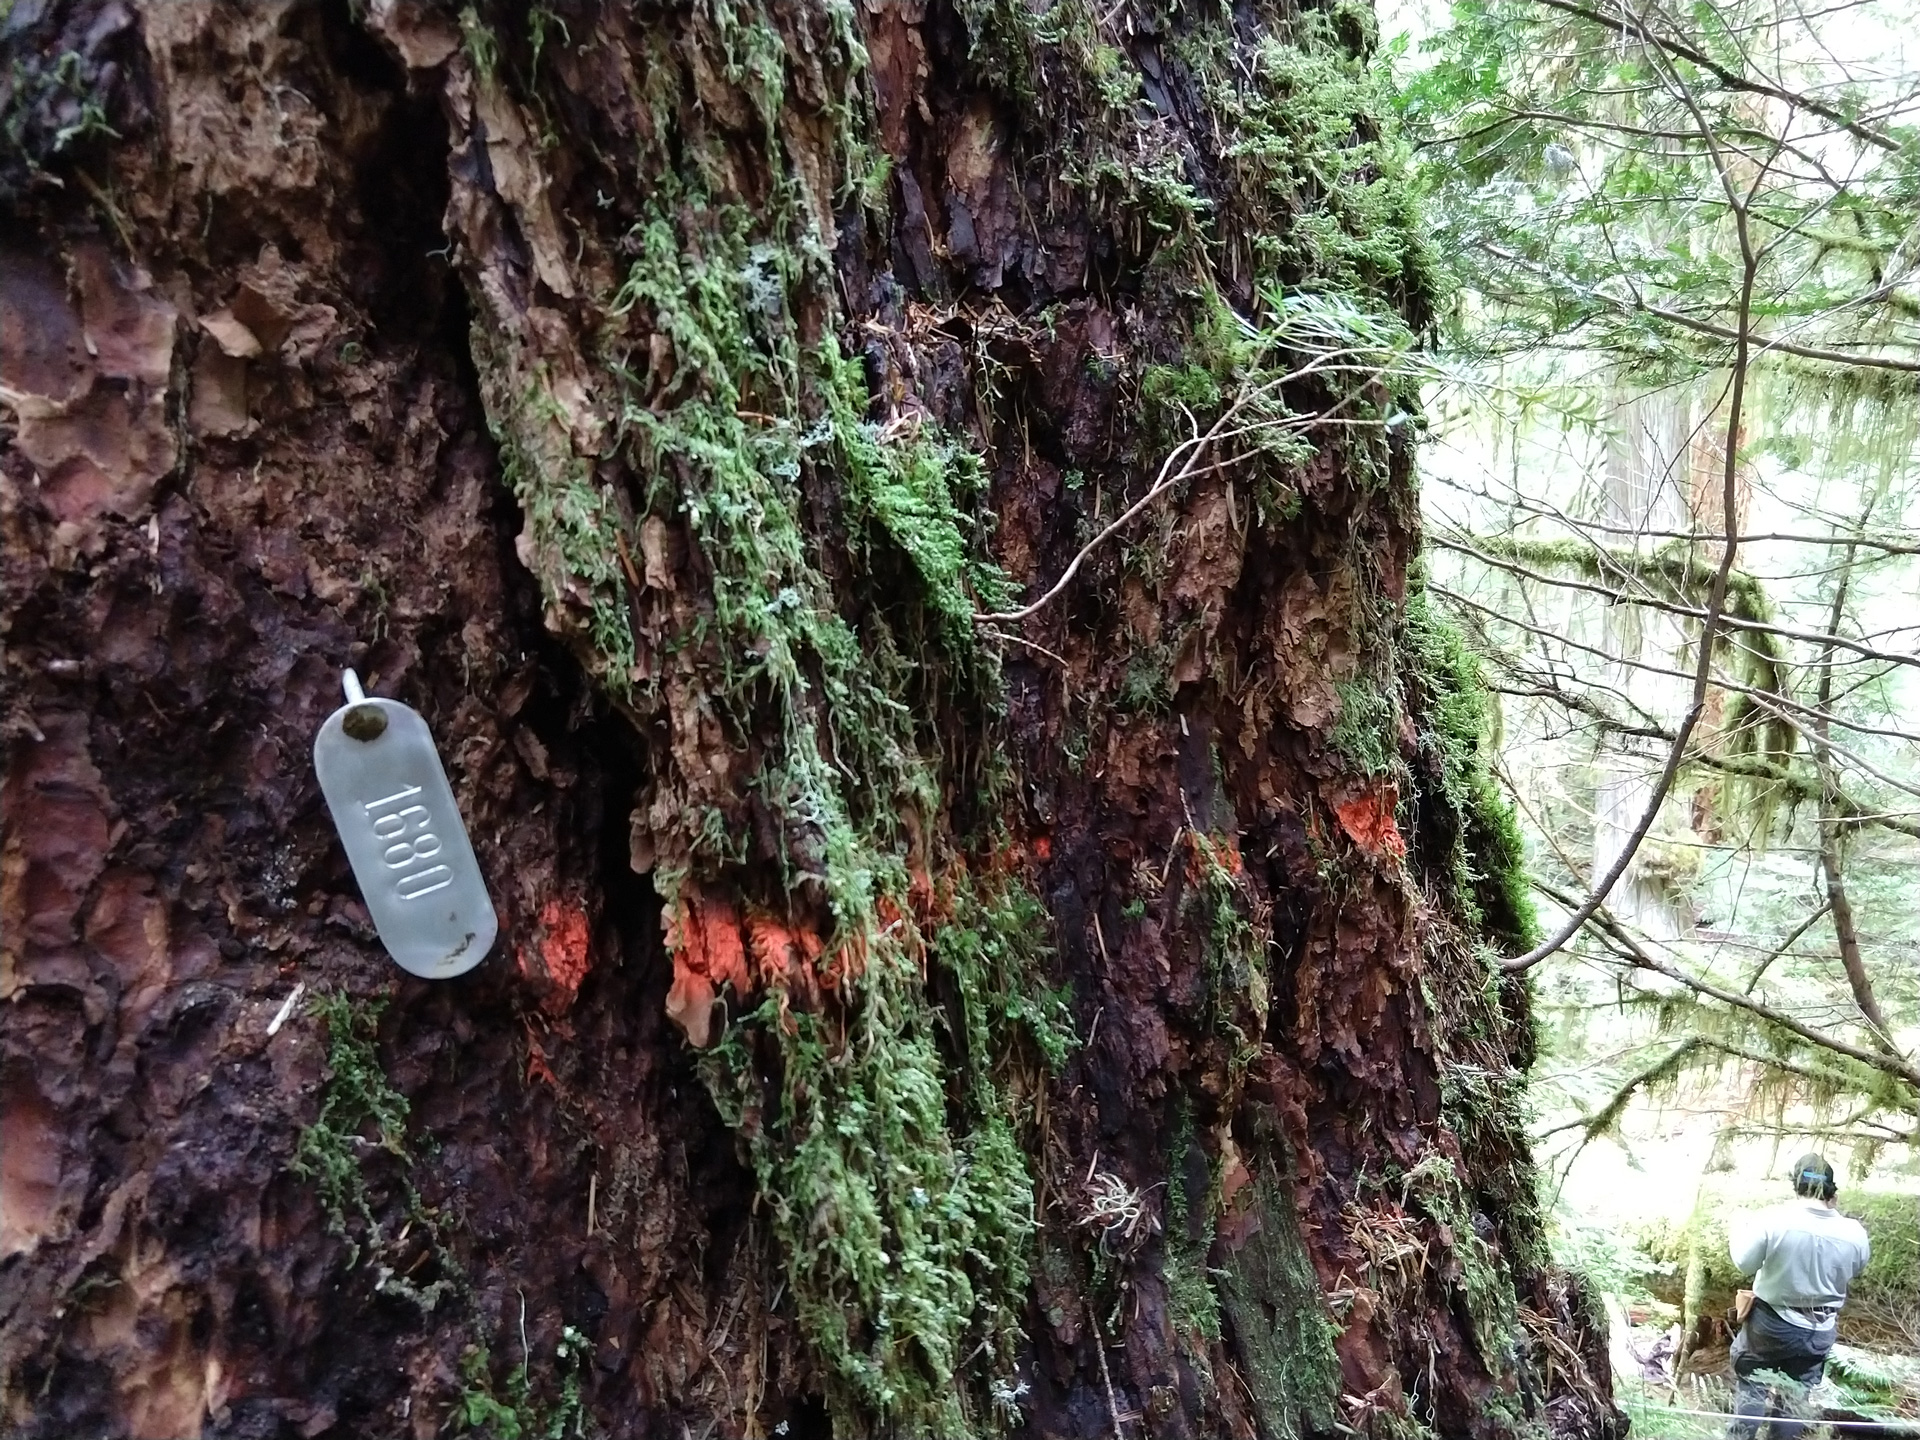
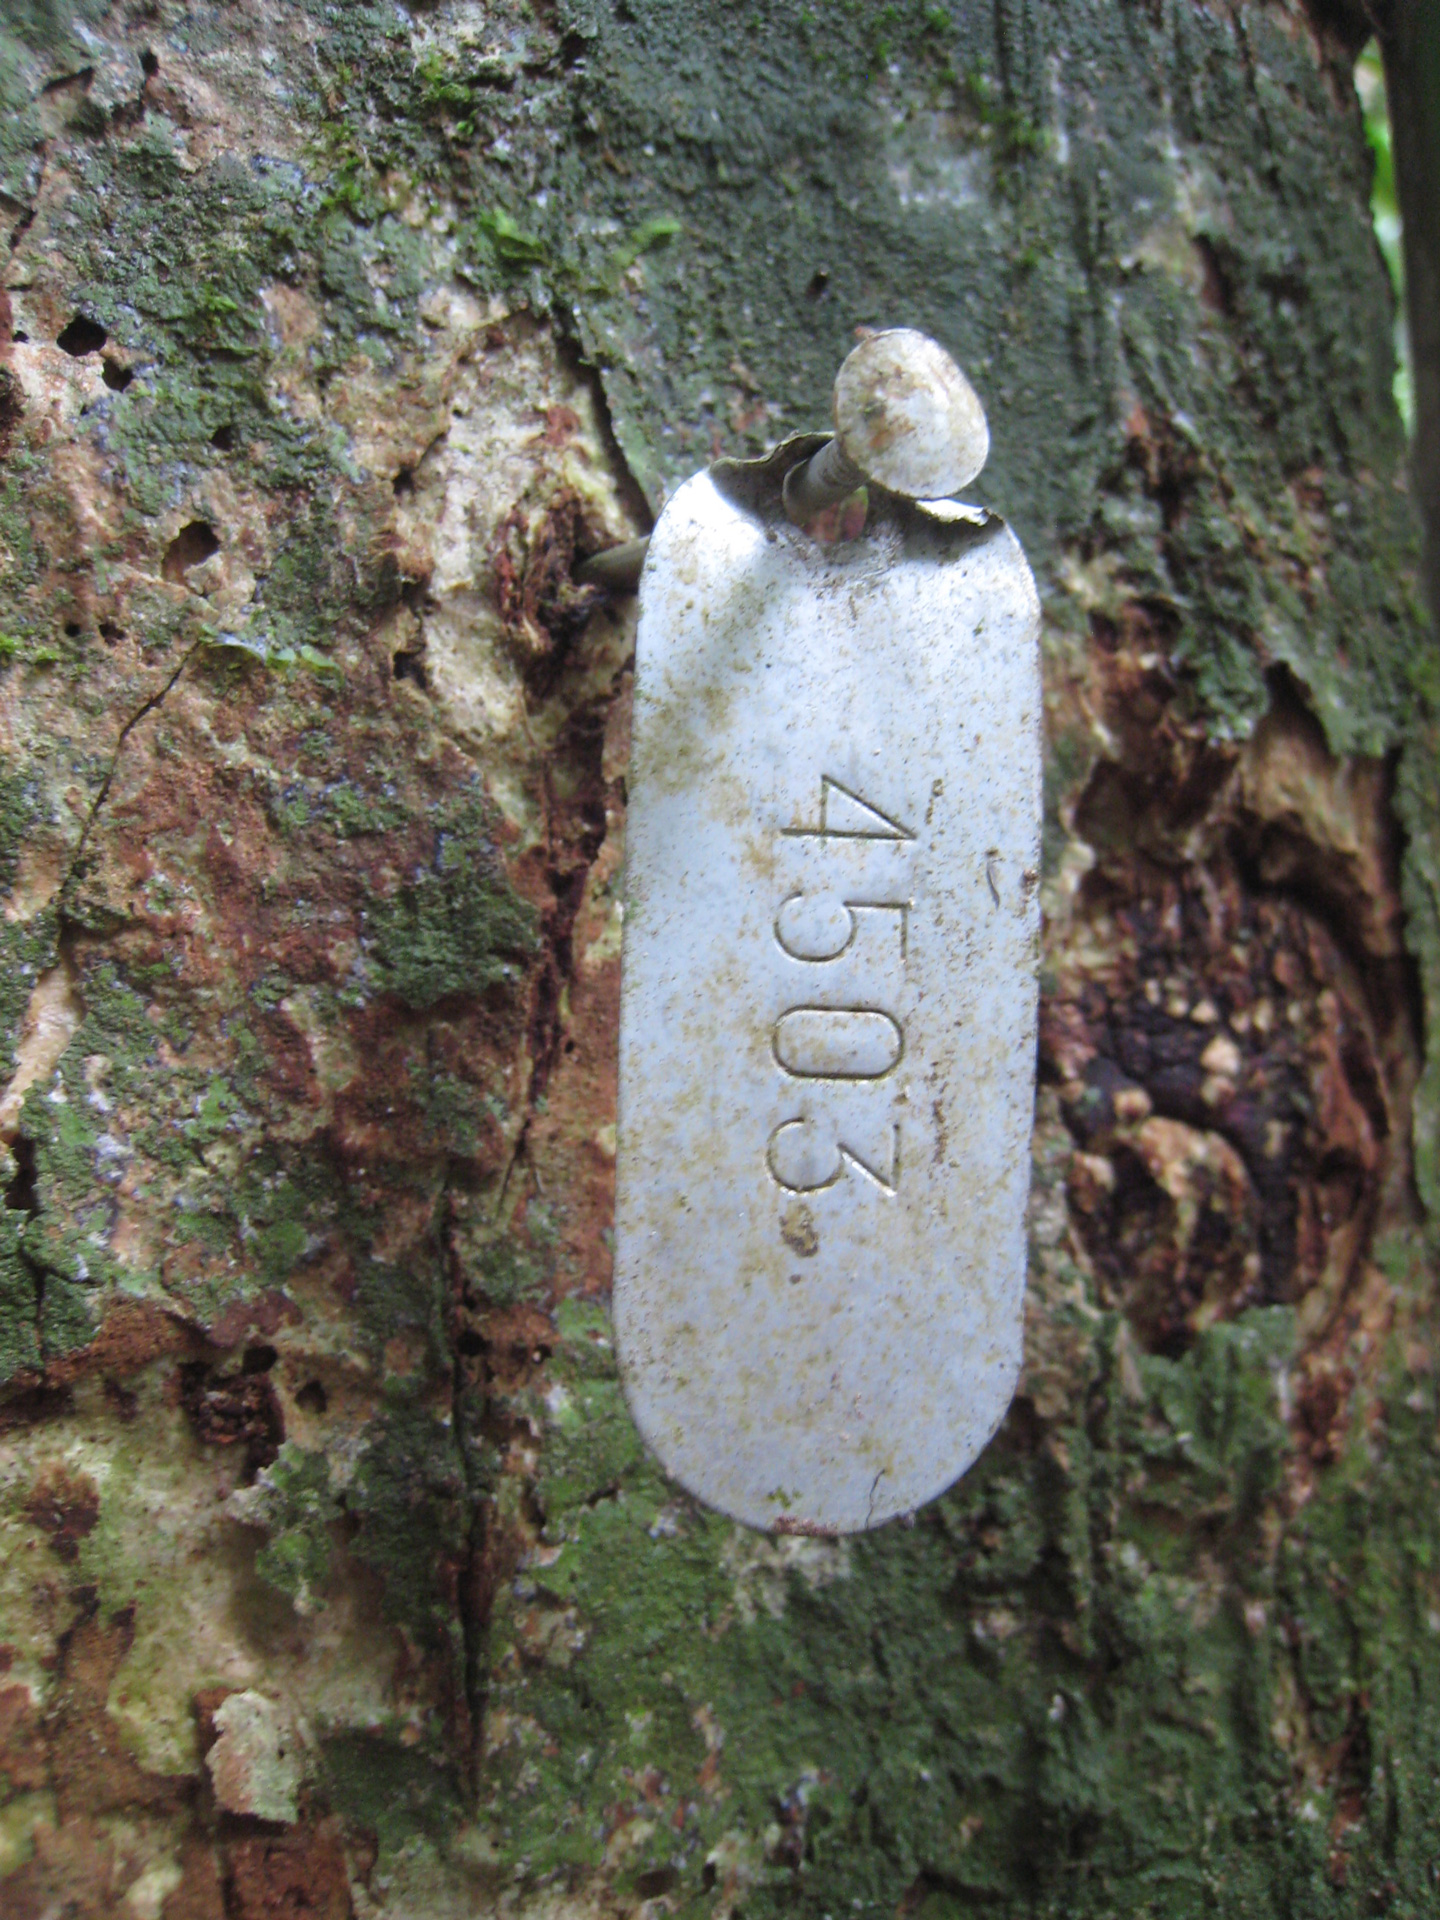
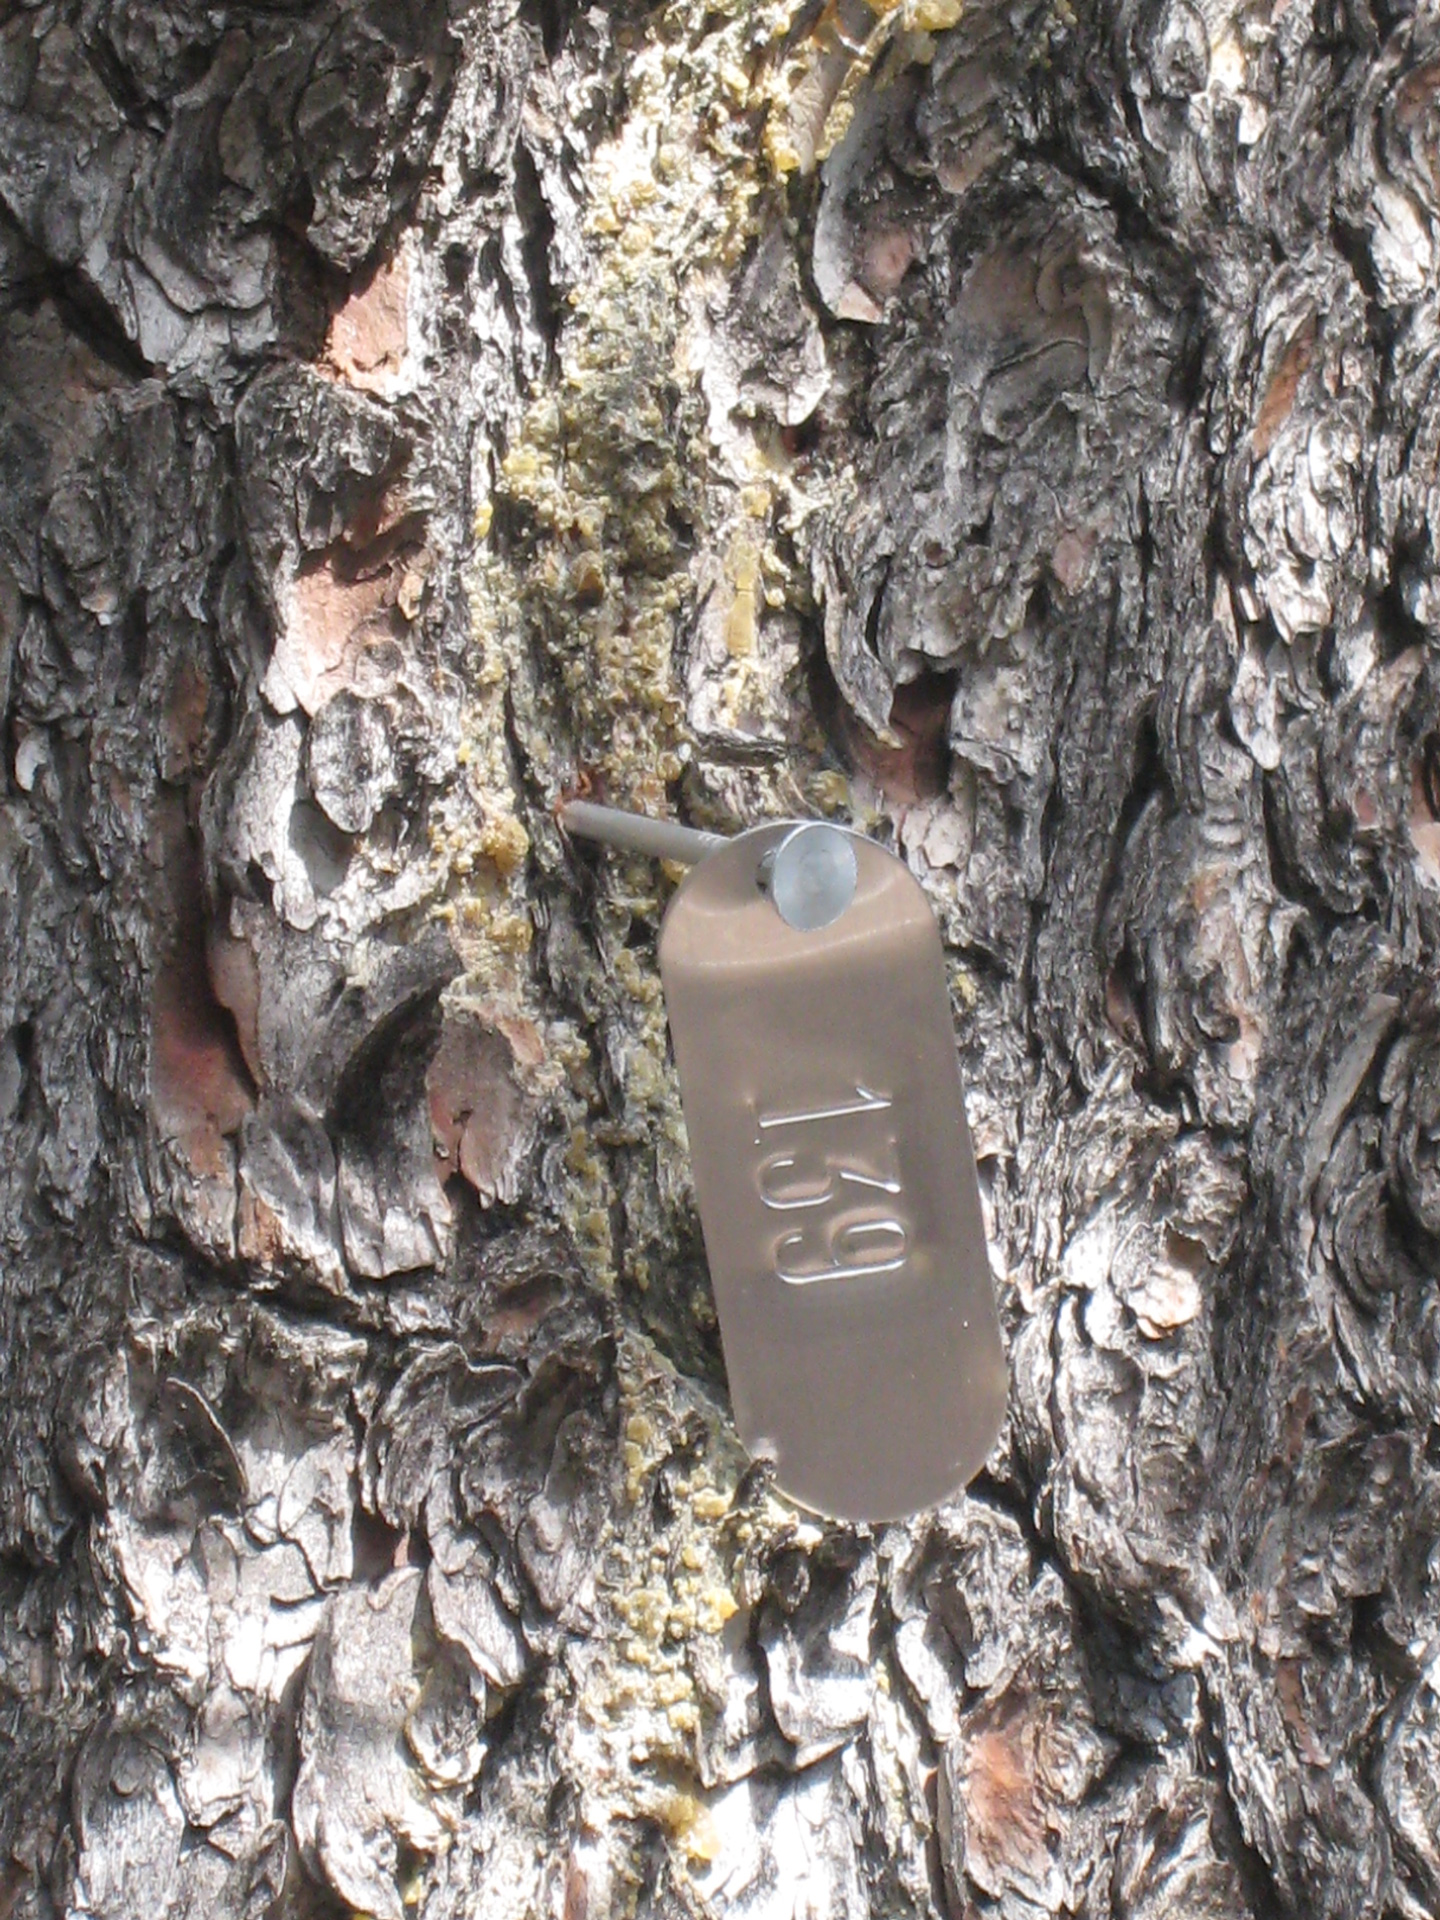
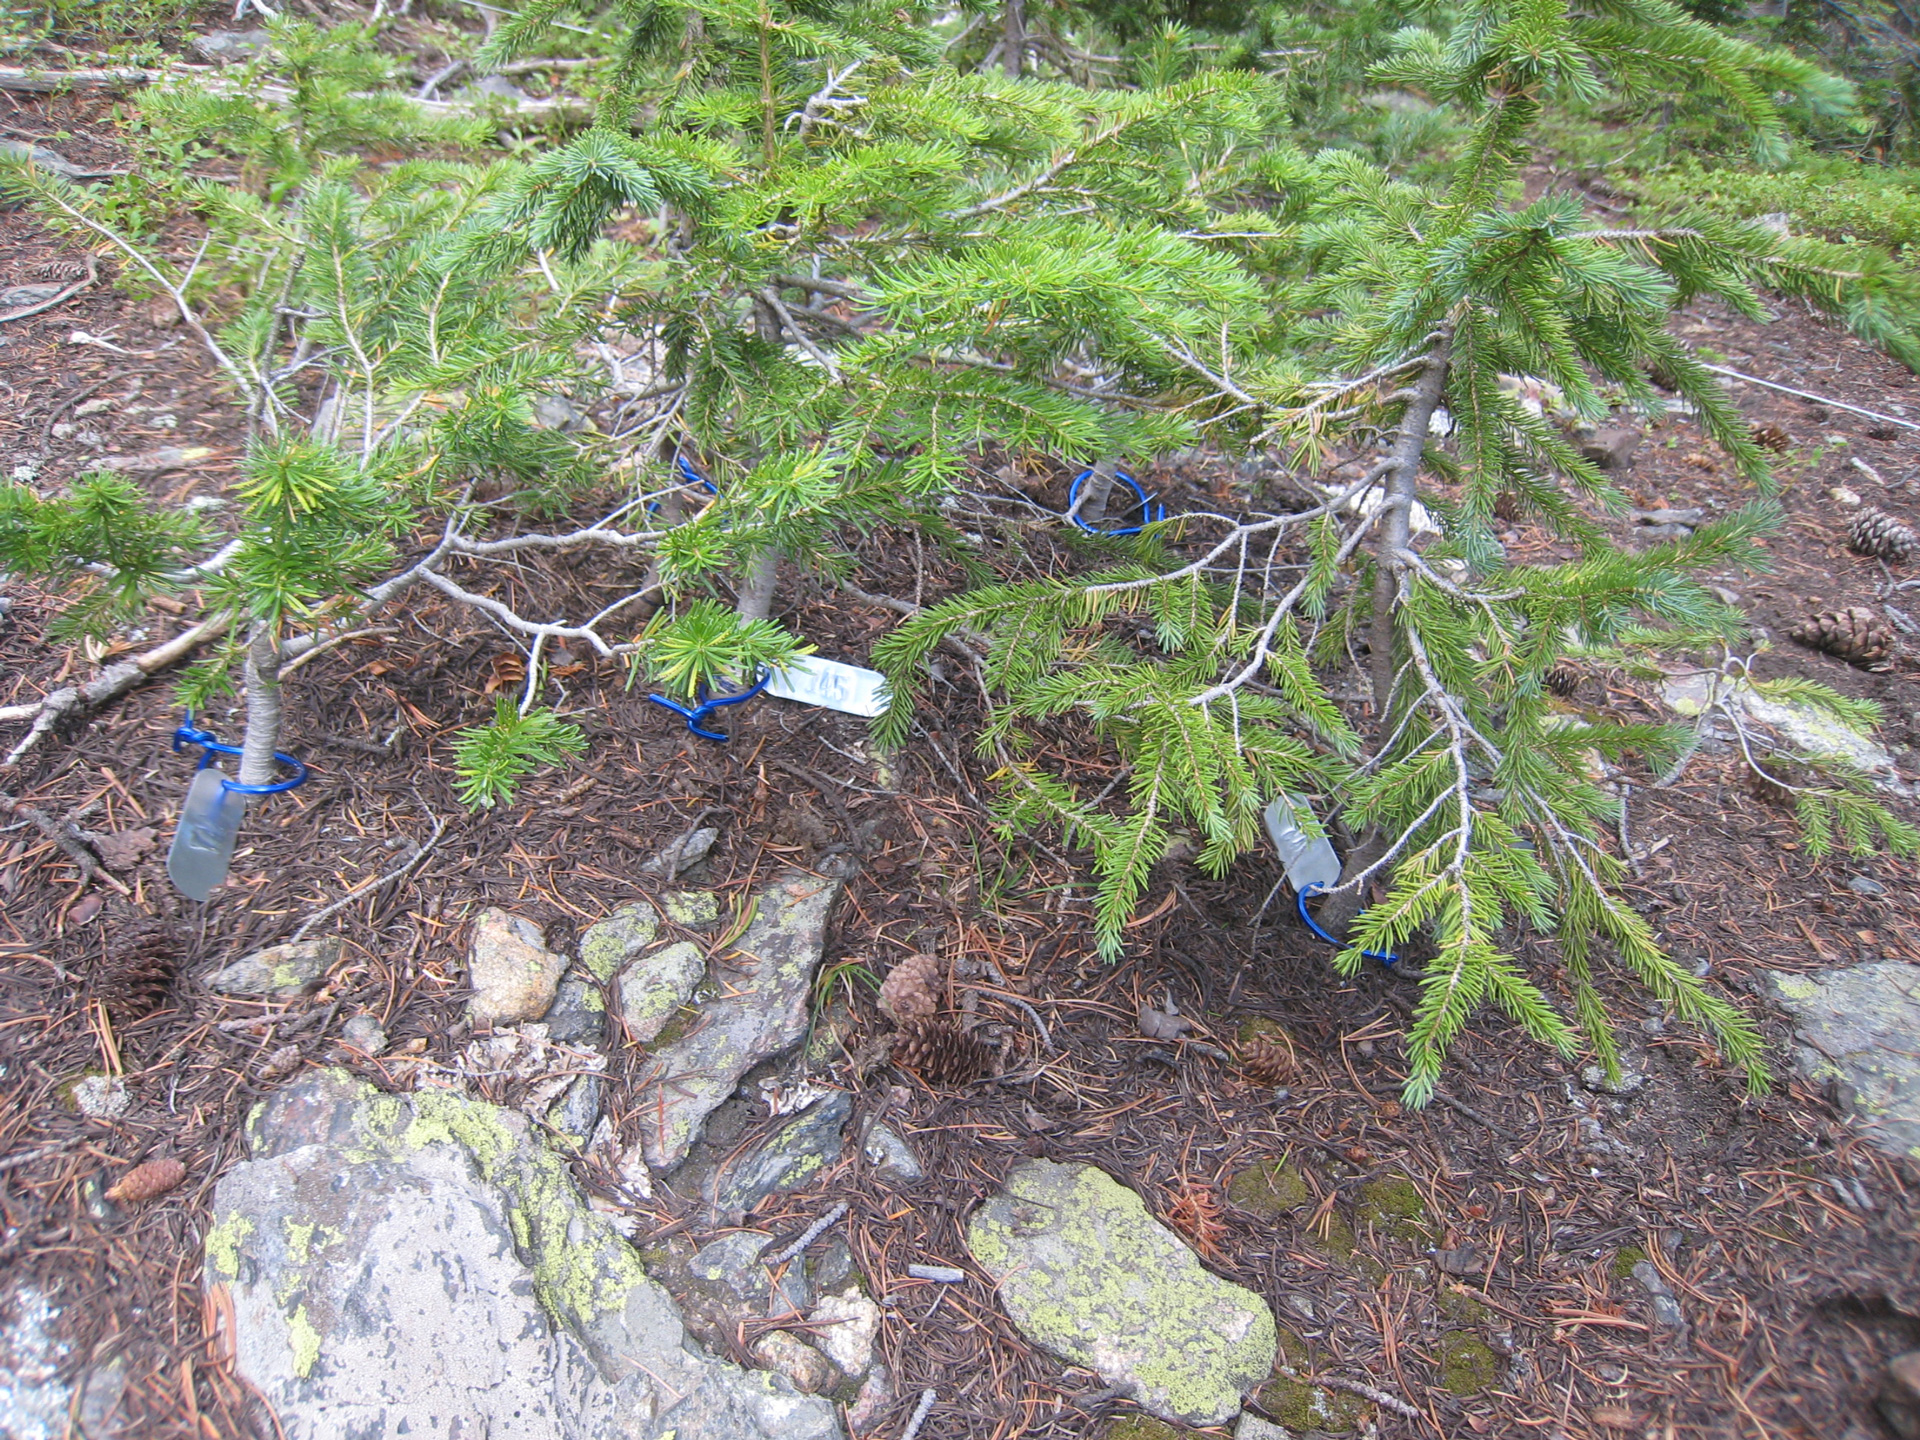
Within the Gentry plots, all plants ≥ 1 cm diameter at the ground are tagged, identified to species, and measured for diameter. Each year, the plots are censused and remeasured, yielding long term data for plant diversity, demographics, and growth.
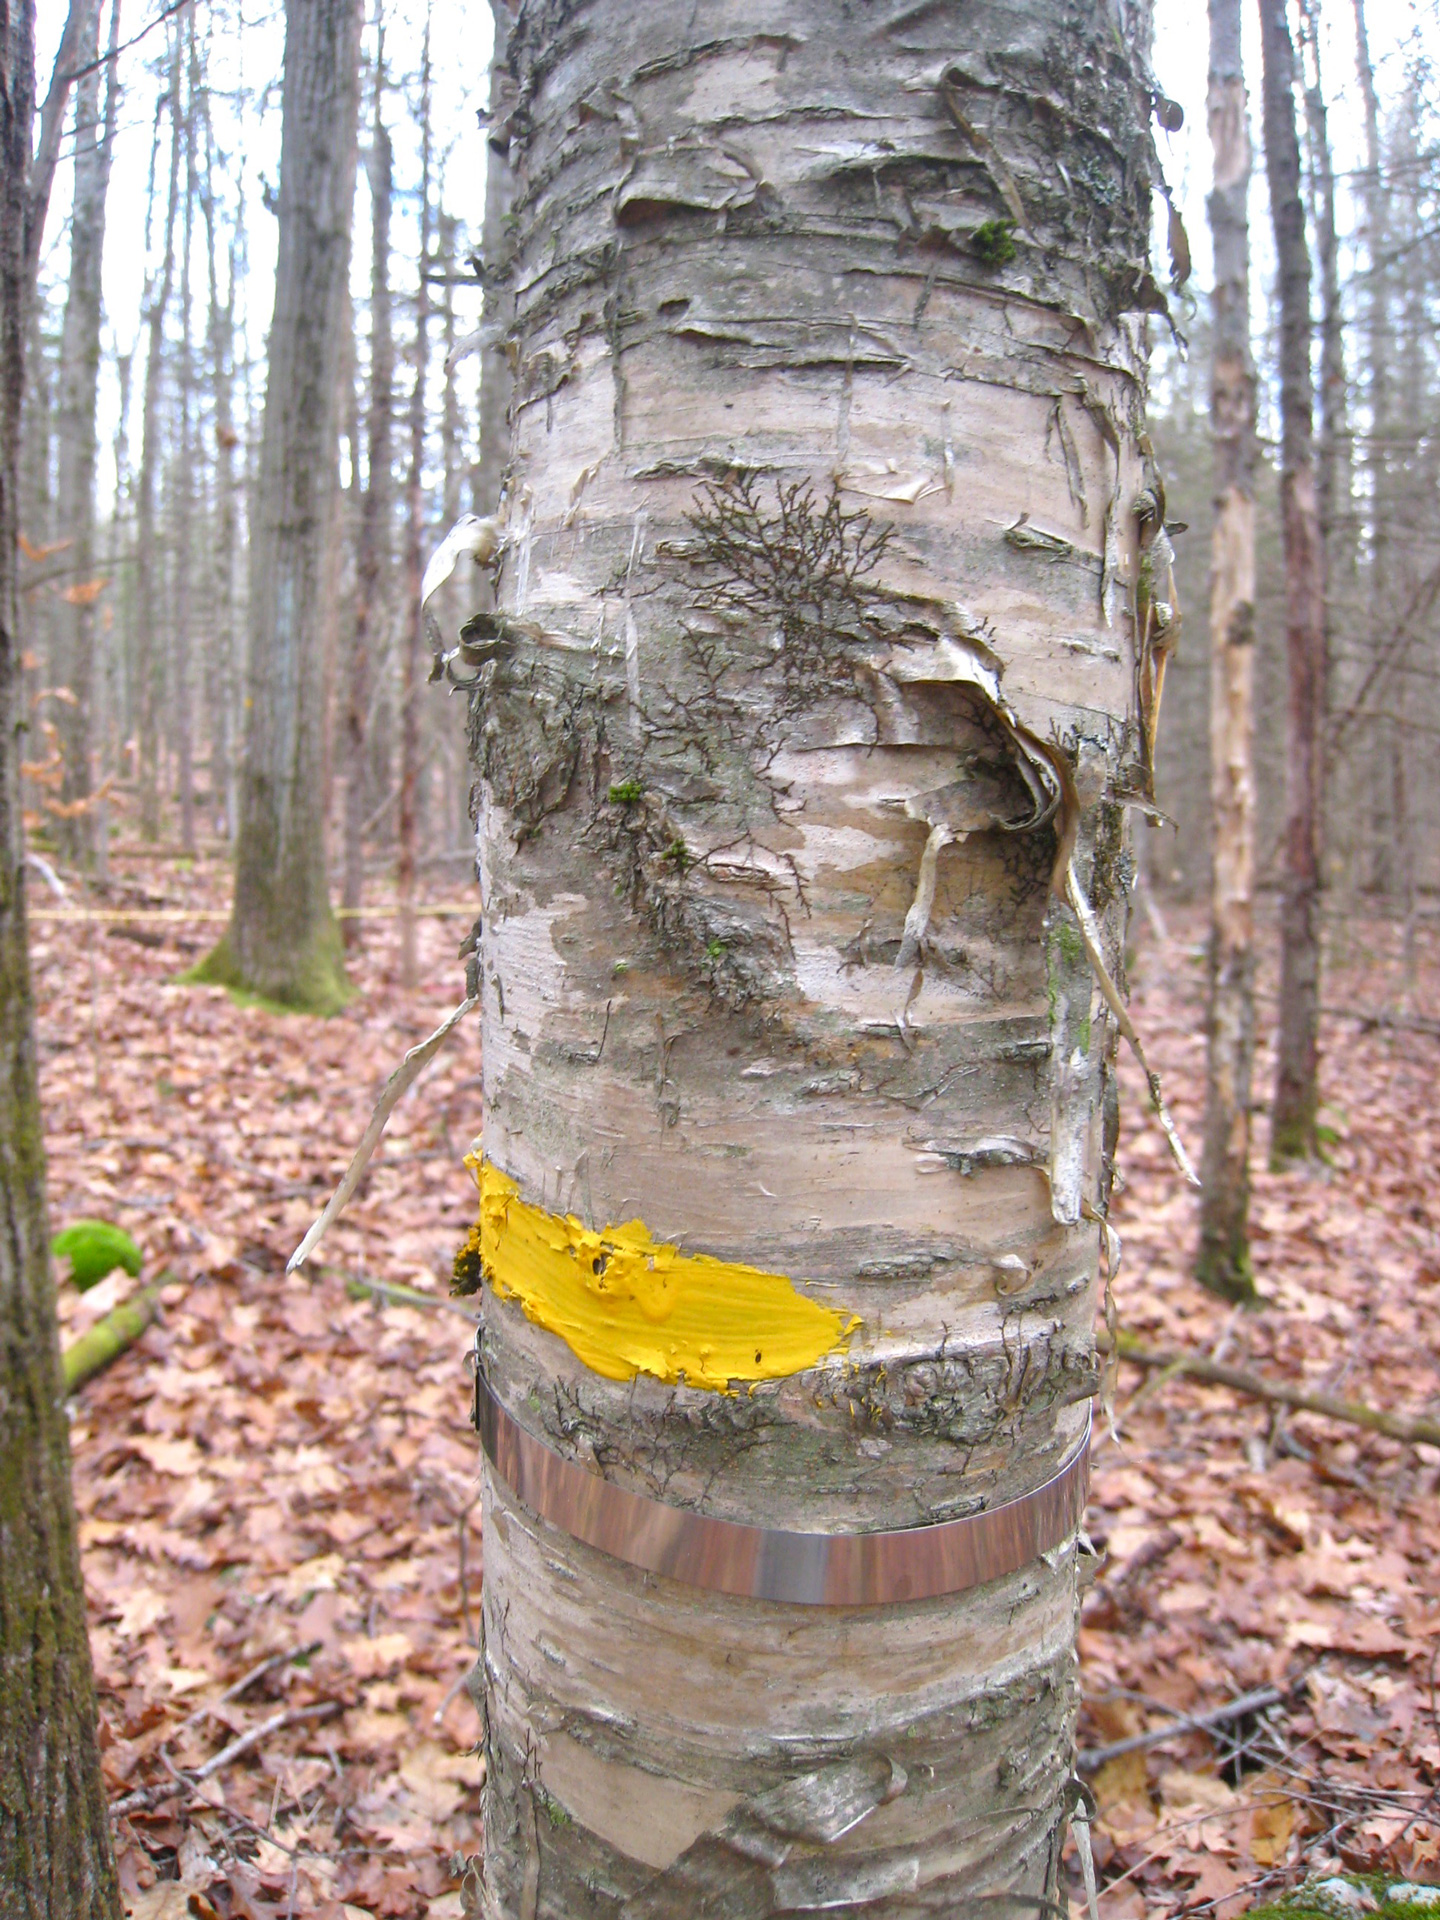
We also quantify tree growth rates via dendrometers installed on ~100 trees per site, and collect plot-level data for plant functional traits and climate (soil and atmosphere) at each site.
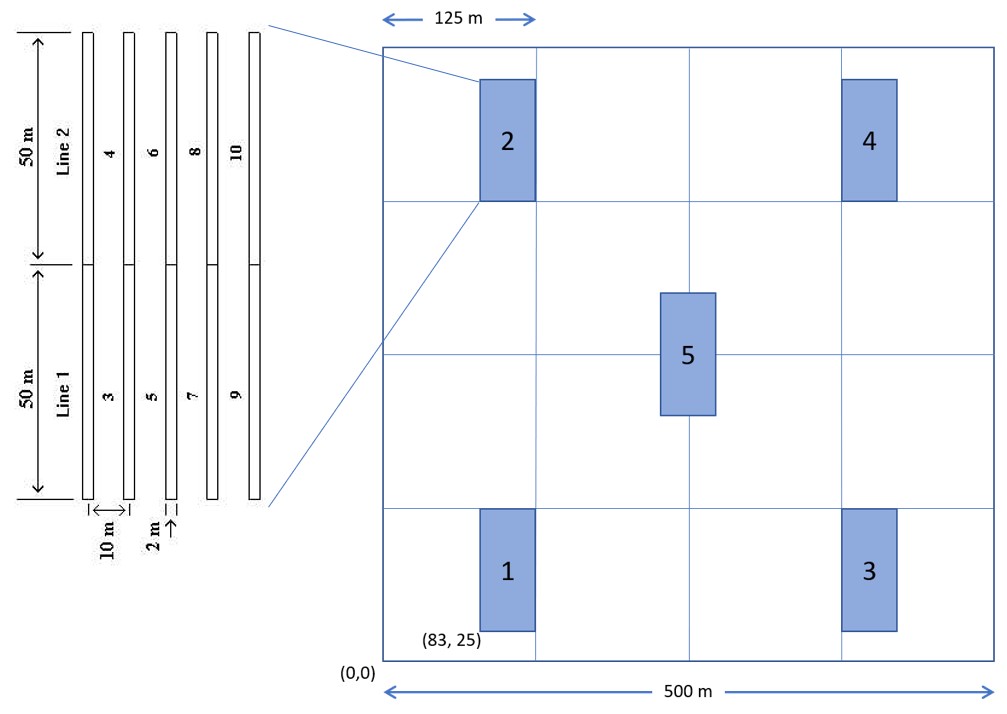
Figure 1: The Forest MacroSystems plot design showing the relative locations of the five subplots. Each subplot comprises ten 50 x 2 m belt transects.

